To plot graphs in Python you can use popular library Matplotlib. I would recommend creating separate virtual environment and then installing matplotlib.
Installing matplotlib in Virtual Environment
Create virtual environment using following command
virtualenv ~/.venvs/matplotlibActivate virtual environment
. ~/.venvs/matplotlib/bin/activateInstall Matplotlib
pip install matplotlibGraphing Parabola
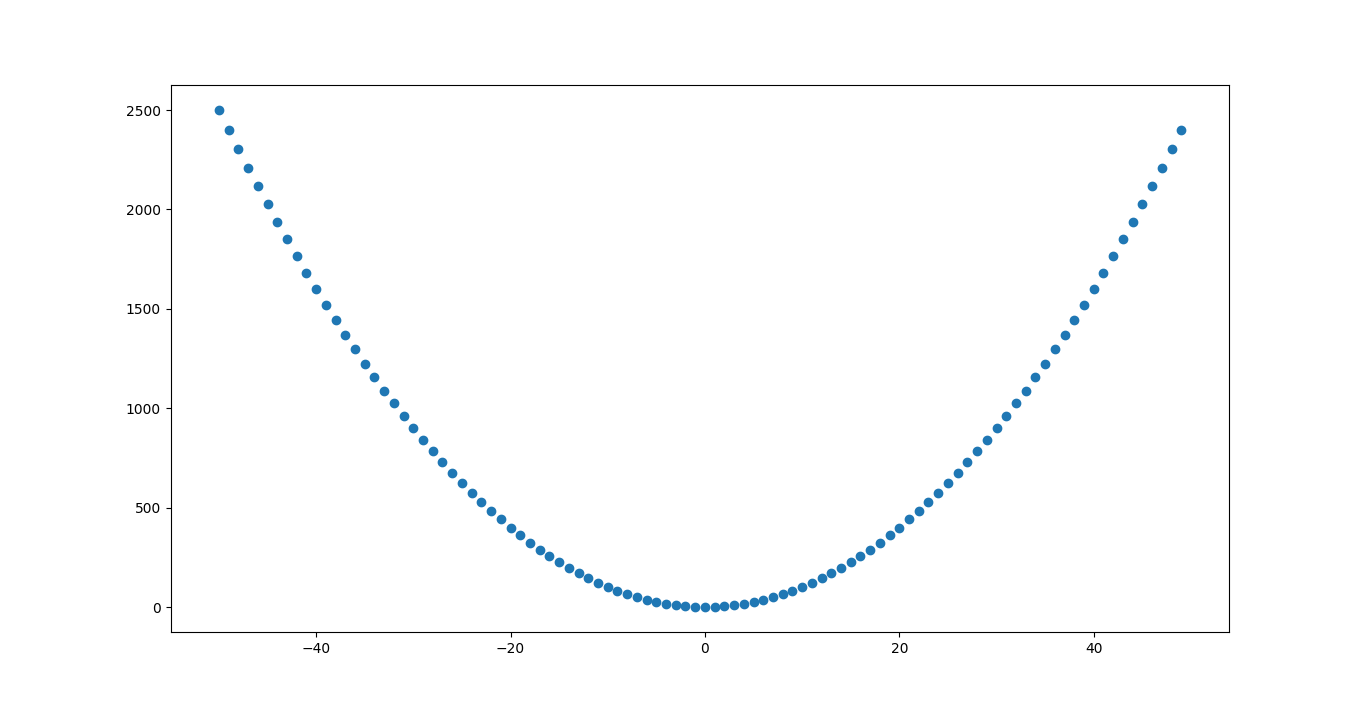
Below code will graph simple parabola y = x2. Range of function would be (-50, 50).
import matplotlib.pyplot as plt

x_cords = range(-50,50)
y_cords = [x*x for x in x_cords]

plt.scatter(x_cords, y_cords)
plt.show()
Output